Field service organizations thrive on efficiency, customer satisfaction, and profitability. In an industry where teams operate off-site, field service performance metrics provide critical visibility into operations.
Managers and executives rely on these key metrics (from response times to customer feedback scores) to gauge the performance of their field service teams. For field service managers, technicians, and business leaders, understanding these numbers isn’t just about tracking progress – it’s about identifying opportunities for improvement and ensuring service quality.
In this blog, we outline the most important field service KPIs (Key Performance Indicators) and provide guidance on how to leverage them effectively. You’ll learn why these KPIs matter, how to track and improve them, and best practices for a KPI-driven field service operation.
By the end, you’ll have a blueprint for using KPI-based field service performance analysis to drive efficiency, delight customers, and grow your business.
What are Field Service Performance Metrics?
They are quantifiable measures of the work that field teams perform for customers at off-site locations. These metrics capture how effectively and efficiently field service operations are being carried out, from the time it takes to respond to a service call to the rate of first-visit resolutions.
What are Field Service Key Performance Indicators?
A key performance indicator for field service is a metric that is particularly tied to strategic goals or service quality standards. Organizations customize these KPIs as per unique business challenges and opportunities in field service. In other words, all KPIs are metrics, but not all metrics are KPIs.

Field service management metrics help translate daily service activities into actionable insights, supporting data-driven decisions. The remainder of this guide breaks down core field service KPIs into four categories:
- Operational Efficiency
- Customer Experience
- Financial Performance
- Maintenance & Reliability
Before we explore how each set of metrics contributes to KPI-based field service performance analysis and improvement, let’s have a look at the key benefits.
Why Field Service KPIs Matter – Key Benefits
Implementing a KPI-driven field service management approach yields significant benefits for organizations. Some of the key advantages include:
Increased Customer Satisfaction:
Tracking service quality metrics (like First-Time Fix Rate and Customer Satisfaction Score) helps ensure customers are happy with the service. High performance on these KPIs leads to quicker resolutions and fewer repeat issues, directly boosting customer loyalty. Satisfied customers are more likely to become repeat clients and recommend your services to others.
Improved Resource Management & Efficiency:
Field service performance metrics focused on efficiency (such as technician utilization or travel time) highlight how well resources are used. By monitoring these, managers can optimize scheduling, reduce idle time, and ensure technicians spend more time on billable work and less on transit or paperwork. This leads to leaner operations and more jobs completed per day.
Reduced Operational Costs:
Closely related to efficiency, KPIs help identify waste and cost drivers. For instance, a high repeat-visit rate indicates extra travel and labor costs for follow-ups. Reducing that through better training or inventory preparedness lowers expenses. Similarly, improving first-visit resolution avoids the cost of sending technicians out multiple times, saving hundreds of dollars per avoided “truck roll” (service visit).
Enhanced Service Quality & Compliance:
Performance indicators like SLA compliance and equipment uptime ensure the company meets its service commitments. Monitoring these helps avoid penalties for missed Service Level Agreements and maintains uptime for customer equipment, thereby protecting the company’s reputation.
Data-Driven Decision Making:
When metrics are systematically tracked, management decisions can be based on facts rather than gut feeling. Trends in the data can reveal emerging issues or opportunities – for example, noticing a rise in response times in a region could prompt the reallocation of technicians. Overall, field service KPIs enable continuous improvement by creating a feedback loop of measurement and adjustment.
Field Service Operational Efficiency Metrics
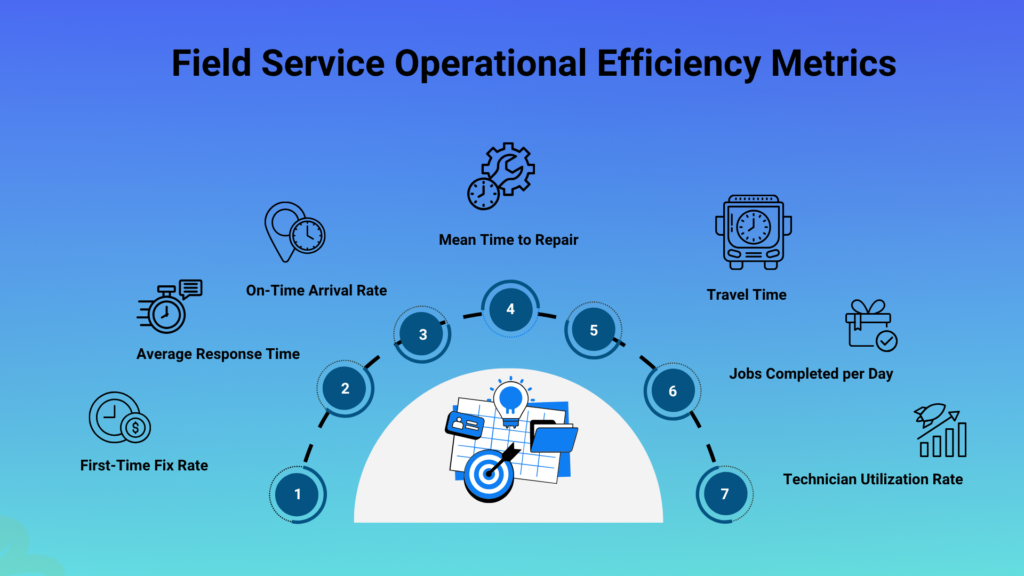
Operational efficiency metrics measure the productivity and time-effectiveness of your field service team. These field service management metrics focus on how quickly and effectively technicians can respond to and complete service jobs. Key operational KPIs include:
First-Time Fix Rate (FTFR):
The percentage of service calls resolved on the first visit. A high FTFR means technicians are diagnosing and fixing issues without needing return visits. This metric is crucial for both efficiency and customer happiness – it minimizes downtime and extra trips. Industry research shows an average FTFR of about 77%, meaning nearly 1 in 4 issues require more than one visit. Improving FTFR (through better training, troubleshooting tools, or inventory management) can significantly cut costs and boost satisfaction.
Average Response Time:
How quickly your team responds to a service request or incident. This can be measured from the moment a customer requests to the time a technician arrives on-site (or begins work). Shorter response times indicate an agile dispatch and scheduling process. Monitoring this KPI helps ensure you meet customer expectations for prompt service. You might analyze response time by priority level or region to identify bottlenecks.
On-Time Arrival Rate:
The percentage of appointments or service windows met on schedule. This KPI reflects scheduling efficiency and promise-keeping. A high on-time arrival rate builds customer trust (nobody likes waiting past the promised window). If on-time performance is lagging, it may signal issues in scheduling, unrealistic time windows, or routing problems. Optimizing travel routes and allowing buffer times can improve this metric.
Mean Time to Repair (MTTR) / Average Repair Time:
The average time it takes to complete a repair or service job once a technician is on site. It’s a key efficiency indicator: a lower MTTR means issues are resolved faster. By tracking MTTR, you can spot if certain job types or teams take longer and investigate why. Process improvements, better diagnostic tools, or more accessible knowledge bases can help reduce repair times.
Travel Time (and Distance):
The average time technicians spend traveling to job locations, or the total mileage per day. Excessive travel time can be a drain on productivity and fuel costs. Tracking this metric helps with route optimization efforts. For example, grouping jobs by geography or using route planning algorithms can shorten routes and reduce travel hours.
Jobs Completed per Day (Productivity Rate):
The number of work orders or jobs a technician (or the team) completes in a day. This metric encapsulates overall productivity, influenced by all factors above (response, repair, travel, etc.). Monitoring jobs-per-day helps gauge if your team is hitting expected output. Be careful to balance quantity with quality – rushing jobs just to increase this number can hurt the first-time fix rate and customer satisfaction.
Technician Utilization Rate:
The percentage of a technician’s working time that is spent on billable or productive tasks (as opposed to idle or waiting time). High utilization means your workforce is being effectively deployed on revenue-generating work. However, 100% utilization isn’t realistic – technicians need some buffer for breaks, training, and unforeseen issues. Track this to identify if technicians are under-allocated or over-extended.
Field Service Customer Experience Metrics
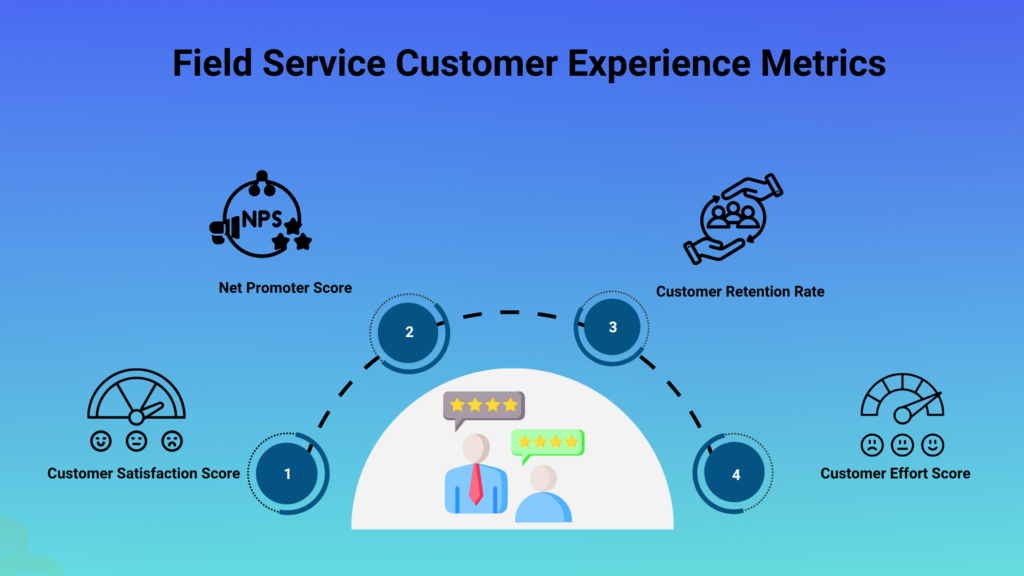
Customer-centric KPIs reveal how well your field service operations are meeting or exceeding customer expectations. These metrics directly tie to service quality and satisfaction. Important customer experience metrics include:
Customer Satisfaction Score (CSAT):
A direct measurement of how satisfied customers are with the service visit, typically collected via surveys or ratings after service completion. CSAT is often expressed as a percentage or score out of 5 or 10. A high CSAT indicates technicians were courteous, resolved issues effectively, and met expectations. Monitoring CSAT per job or technician helps identify patterns, such as a specific region with consistently lower scores, which may signal the need for training or process changes.
Net Promoter Score (NPS):
A broader loyalty metric gauges how likely customers are to recommend your company. It’s derived from asking customers to rate (0-10) how likely they are to recommend the service, then subtracting detractors from promoters. To improve NPS in field service, ensure consistency across all touchpoints: scheduling, on-site experience, and follow-up. High NPS reflects satisfaction and trust, key indicators of long-term loyalty.
Customer Retention Rate:
The percentage of customers who stay with your service over time (or repeatedly use your service, if applicable). In businesses with service contracts or repeat maintenance schedules, retention is critical. High retention signals reliability and customer value. If retention declines, investigate possible causes such as poor first-time fix rates or communication gaps. Improvements in KPIs like FTFR, CSAT, and punctuality often raise retention. Some organizations also track churn rate (the inverse of retention) to detect service quality issues.
Customer Effort Score (CES) :
This newer metric measures how easy it was for the customer to get their issue resolved. In field service, CES can apply to processes like scheduling an appointment or getting a repair. A low effort (easy process) correlates with higher satisfaction. CES is useful for companies prioritizing ease of service via portals or streamlined communication.
Field Service Financial Performance Metrics
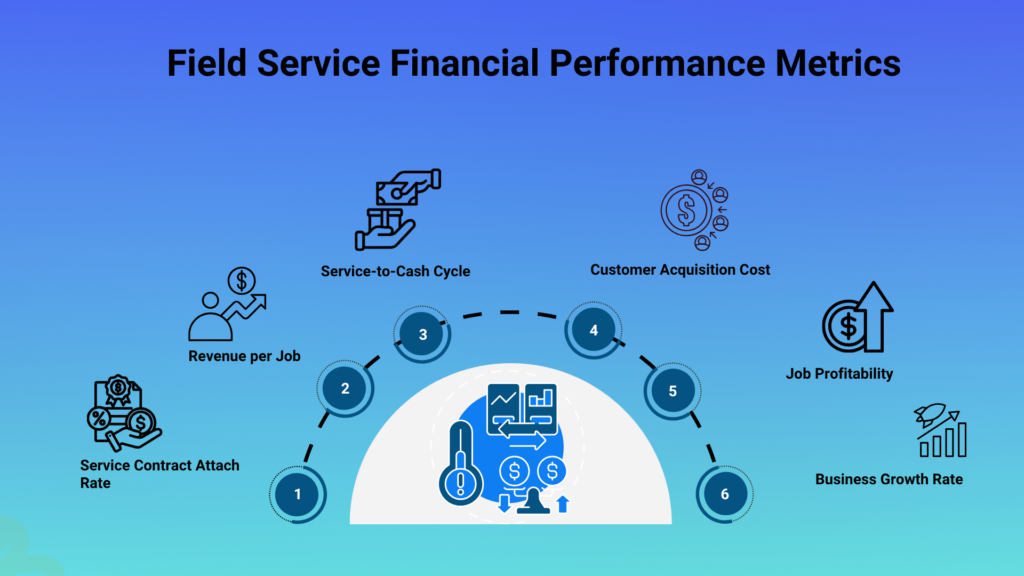
These KPIs tie field service operations to financial outcomes – revenue, cost, and profitability. They are especially vital for executives and owners to ensure the service department contributes to business goals. Key financial and business metrics include:
Service Contract Attach Rate:
The rate at which service contracts or maintenance agreements are sold relative to eligible sales. Expressed as a percentage of customers or products that include a service contract. A higher attach rate means more recurring revenue and stronger customer commitment. Field service teams often help sell or renew these contracts (e.g., upselling a maintenance plan). Monitoring this KPI helps align service and sales efforts. If the rate is low, train technicians to better communicate the value or adjust pricing and incentives.
Average Ticket Price / Revenue per Job:
The average revenue earned per service job. This shows how much value is generated on each call and whether technicians capitalize on upsell opportunities. For example, spotting additional repairs or replacements during a visit and converting them into sales raises the average ticket. Tracking this over time reveals profitability trends and cross-selling effectiveness. Tools like mobile quoting apps (e.g., within Dynamics 365 Field Service) help techs present add-ons on the spot.
Service-to-Cash Cycle Time:
How long does it take to convert completed service into revenue—i.e., job completion to payment. A shorter cycle improves cash flow. Delays often stem from slow invoicing or collections. If this metric is high, consider automating invoicing and payment. Allowing techs to capture signatures and payments in the field can reduce delays. As a result, this KPI ensures operational efficiency leads to financial efficiency.
Customer Acquisition Cost (CAC):
The cost to acquire a new customer, usually marketing and sales spend divided by new customers gained. While not exclusive to field service, it matters for businesses offering contracts or subscriptions. Rising CAC could indicate inefficient marketing or weak referrals. Providing excellent service (high NPS, CSAT) helps reduce CAC through positive word-of-mouth.
Job Profitability / Margin:
The profit from each job, calculated as revenue minus job-specific costs (labor, parts, travel). Monitoring profitability per job or contract helps identify types of work that are most lucrative or loss-making. For example, emergency repairs might have slim margins due to high costs. These insights guide pricing strategies. Improving KPIs like first-time fix also boosts profitability.
Business Growth Rate:
Growth can be measured by metrics like year-over-year service revenue growth, increase in the number of service contracts, or expansion of the customer base. This KPI shows whether field service is growing with business goals. If you segment out field service in your financials, you can track how much that segment is expanding. Better retention and upselling improve growth. Flat or negative trends may indicate customer attrition or rising competition.
Maintenance and Reliability Metrics in Field Service
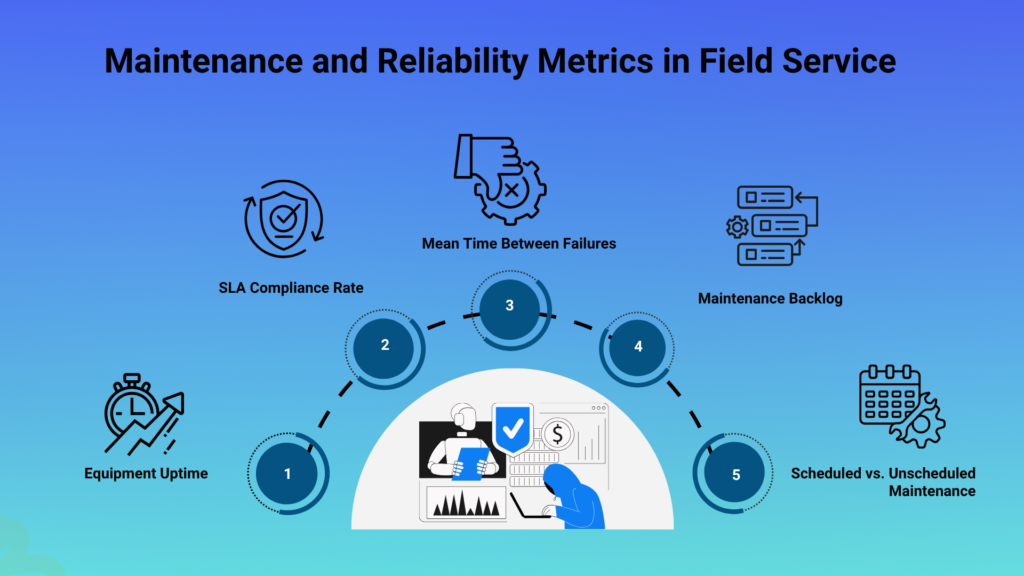
For organizations that service equipment or perform maintenance contracts, tracking reliability and maintenance-specific KPIs is essential. These metrics ensure that preventive maintenance programs are effective and downtime is minimized. Key maintenance-focused KPIs include:
Equipment Uptime:
The percentage of time that customer equipment or systems are operational (uptime) within a given period. High uptime is usually the goal of maintenance contracts – it reflects reliability. If you promise, say, 99% uptime in an SLA, tracking actual uptime vs. target is critical. Low uptime or frequent outages indicate the need for more frequent maintenance, better spare parts availability, or even equipment replacement.
SLA Compliance Rate:
The rate at which your team meets response or resolution times as defined in Service Level Agreements, often measured as a percentage. A high SLA compliance rate indicates contractual commitments are met, boosting customer satisfaction and avoiding penalties. Falling short can lead to dissatisfied clients or fines. Improvement may require prioritizing urgent jobs, better scheduling, or equipping technicians with the right tools.
Mean Time Between Failures (MTBF):
If your field service involves maintaining equipment, MTBF measures the average time between one failure and the next. A longer MTBF indicates more reliable equipment or effective maintenance. This metric helps in planning preventive maintenance schedules – if MTBF is getting shorter for a certain asset type, it might signal wear-and-tear or design issues.
Maintenance Backlog:
The volume of pending maintenance work (approved but not yet completed tasks). A manageable backlog indicates your team can keep up with preventive maintenance demand. If the backlog grows too large, it could mean your team is understaffed or tasks are not being completed on time, potentially leading to missed maintenance and future breakdowns.
Scheduled vs. Unscheduled Maintenance Ratio:
This metric compares how much of your work is planned (scheduled maintenance) versus reactive (breakdowns). A higher ratio of scheduled to unscheduled maintenance is usually positive, as it means you’re catching issues proactively rather than reacting after failures. Improving this ratio can involve implementing better preventive maintenance programs or IoT monitoring to predict failures.
KPI-Based Field Service Performance Analysis and Improvement
Collecting data is only the first step – the real value comes from KPI-based field service performance analysis. In this section, we discuss how to turn metrics into actionable insights for continuous improvement:
Trend Analysis:
Regularly analyze trends in your KPIs over time. Look for patterns such as seasonal fluctuations or gradual improvements/declines in metrics. For instance, if you see the first-time fix rate trending downward for three months straight, that’s a signal to investigate root causes. By plotting metrics on graphs or dashboards, you can visually detect these trends quickly.
Benchmarking and Targets:
Establish benchmarks for your KPIs – both internal (historical performance) and external (industry standards). Knowing that the industry average FTFR is ~77% can help you set a target above that. Set specific targets (SMART goals) for each KPI so everyone knows what “good” looks like. If a target isn’t met, perform a gap analysis to determine why.
Identifying Bottlenecks and Root Causes:
Use your metrics to pinpoint where issues occur in the service process. For example, if Average Response Time is high, break it down further: Is the delay in dispatch assigning the call, or in travel to the site? If repeat visit rates are high, is it due to incomplete fixes (training issue) or lack of spare parts (inventory issue)? By drilling down into segmented data (by region, by team, by job type), you can find the root causes behind high-level KPI shortfalls.
Customer Feedback Integration:
Combine quantitative KPI analysis with qualitative customer feedback. Metrics like CSAT and NPS will tell you that something is wrong, but customer comments and surveys will tell you why. Moreover, using text analytics on feedback or simply reviewing surveys in regular team meetings can uncover actionable improvement areas tied to your KPIs.
Continuous Improvement Cycle:
Adopt a mindset of continuous improvement (Kaizen) in field service operations. Treat your KPI reviews as an ongoing loop: Measure -> Analyze -> Improve -> Measure again. Over time, this cycle drives incremental gains. Successful field service organizations often have weekly or monthly KPI review meetings where managers and team leads discuss the latest numbers and brainstorm solutions for any metrics below target.
Best Practices for Tracking and Improving Field Service KPIs
Implementing a metrics-driven approach requires more than just picking a few KPIs. Below are best practices and strategies to effectively manage field service performance through KPIs:
-
Align KPIs with Business Objectives
Start by identifying which metrics closely tie to your company’s goals and customer promises. For instance, if your strategy is to maximize customer retention, focus on KPIs like first-time fix, CSAT, and SLA compliance that influence loyalty. Each selected key performance indicator for field service should clearly link to an outcome that leadership cares about.
-
Define Metrics Clearly and Use SMART Goals
Ensure everyone has a clear definition of each KPI (how it’s calculated, what’s included/excluded). Ambiguity can lead to inconsistent tracking. Set SMART targets (Specific, Measurable, Achievable, Relevant, Time-bound) for each metric. For example, “Improve first-time fix rate from 80% to 90% by the end of Q4” is a SMART goal. Clear targets motivate teams and make it easier to measure progress.
-
Leverage the Right Field Service Management Tools
Use technology to automate data collection and reporting. A robust field service management software can automatically track metrics such as response times, travel times, work order completion, and even parts usage. It consolidates data in one place,, integrating with CRM and inventory systems, so you’re not manually pulling numbers from disparate sources. Additionally, the software can provide real-time dashboards and alerts.
-
Ensure Data Quality and Consistency
KPIs are only as good as the data behind them. Implement standardized processes for data entry – for instance, technicians should uniformly log start and finish times for jobs to accurately calculate duration-based metrics. Conduct periodic audits to check for anomalies or missing data. If you find data issues, address them with the team through training or system fixes.
-
Provide Training and Build Buy-in
Educate your field technicians and dispatchers on the importance of these KPIs and how their actions influence the numbers. When employees understand why you’re measuring (not just feeling watched), they’re more likely to support the initiative. Some companies establish incentive programs or gamification around KPIs to keep teams engaged in performance improvement.
-
Automate Reporting and Review Frequently
Set up automated reports or dashboards that update KPI values continuously or at least weekly. Regularly review the metrics in team meetings. Frequent visibility ensures that issues are caught early. For instance, if this week’s average repair time spiked, a daily/weekly dashboard helps you notice and react immediately, rather than discovering it at month’s end.
-
Act on the Insights & Iterate
Use insights to implement improvements. If a KPI lags, act with training, process tweaks, or tools. Monitor outcomes. If results fall short, adjust the approach. Continuously refine your KPIs—adding new ones like IoT-based metrics or removing outdated ones. The aim is a flexible KPI strategy that evolves with your business and drives service excellence.
-
Celebrate Successes and Learn from Failures
Share positive KPI trends like improved satisfaction or faster response times with your team. Recognize technician efforts to boost morale and reinforce good behaviors. When targets are missed, use it as a learning opportunity. Analyze the data together, identify improvements, and avoid blame. This approach fosters a culture of ongoing growth, transparency, and continuous improvement.
Visualizing Field Service Metrics: Dashboards and Reports
One of the best ways to maximize the impact of your KPIs is to visualize them. Good visualization turns raw data into intuitive insights that stakeholders can grasp at a glance. Here’s how to leverage dashboards and reports for field service metrics:
Real-Time KPI Dashboards: Live dashboards help monitor essential KPIs like open work orders, average response times, and SLA risks. Supervisors can track metrics such as first-time fix rates and completed jobs versus targets. Visual elements like gauges enhance quick interpretation, for example, a color-coded FTFR dial showing performance zones.
Customized Views for Different Roles: Dashboards should match each role’s needs. Executives may view high-level monthly trends in revenue or retention, while field managers focus on daily operations. Technicians benefit from tracking their own job completion stats and customer feedback, promoting self-awareness and improvement.
Use Visual Alerts and Color-Coding: Apply conditional formatting to flag issues quickly, such as turning the SLA compliance metric red if it dips below 90%. These visual cues help teams respond to problems immediately without digging through raw data.
Periodic Reports & Infographics: Monthly reports offer context behind KPI trends—e.g., a 5% FTFR boost due to recent training. Infographics summarizing annual performance can be shared with stakeholders and repurposed for marketing, reinforcing service excellence.
Interactive Data Exploration: Encourage a data-driven culture by making KPI data accessible. With the right tools, team members can click on a dashboard metric to drill down. This promotes cross-functional collaboration and accountability.
Keep It Simple and Relevant: Focus dashboards on the field service performance metrics that matter most for that viewer. A clean, uncluttered dashboard with a handful of critical KPIs is far more actionable than a complex screen of dozens of charts.
Power Your Field Operations with the Right Metrics and the Right Partner
In the current fast-moving service landscape, field service performance metrics are more than just numbers—they’re the compass for operational excellence, customer loyalty, and business growth. With the right KPIs and a data-driven strategy, organizations can unlock new levels of efficiency and service quality.
At Folio3 Dynamics, we specialize in Microsoft Dynamics 365 Field Service and bring deep expertise to help service teams achieve measurable impact. As a certified Microsoft Dynamics partner, we empower field organizations to make smarter decisions, faster.
Here’s how we can help:
- Dynamics 365 Field Service implementation & customization
- Real-time KPI dashboards and reporting solutions
- Mobile technician enablement tools
- Predictive maintenance with IoT integrations
- SLA management, scheduling, and dispatch automation
If you’re ready to transform your field operations into a growth engine, let’s connect. Choose Folio3 Dynamics—your strategic partner in turning service performance into competitive advantage.