Imagine turning your company’s data into actionable insights at the click of a button—whether you’re managing a startup or running a multinational enterprise, this is the promise of Business Intelligence (BI).
At its core, business intelligence is the process of collecting, analyzing, and transforming raw data into meaningful insights that support smarter decision-making. It brings together tools, technologies, and strategies—often packaged as business intelligence solutions and applications, designed to make data more accessible and useful across your organization.
Currently, the BI and analytics market is projected to reach almost $68.72 billion by 2032, growing at nearly 10% annually. Still, adoption remains low: only 26% of companies are fully leveraging BI, with smaller firms significantly trailing behind. This gap represents both a challenge and an opportunity, especially for those willing to act early.
Today’s businesses rely on BI to answer critical questions like:
- What’s driving or slowing our revenue?
- Where are we overspending or underperforming?
- How are customers interacting with our brand?
- Which products or regions offer the most growth potential?
To help you sort these queries at a practical level with possible solutions, we’ll walk you through the following aspect of business intelligence in this blog:
- Common business intelligence applications
- Leading business intelligence solutions and how to choose them
- Real-world BI examples
- Practical tips to build a data-driven organization
To understand the power of BI, it helps to start with the fundamentals—what it is, how it works, and why it’s more than just reporting.
What Is Business Intelligence (BI)?
Business intelligence (BI) refers to the technology-driven processes and tools that enable businesses to collect, organize, analyze, and contextualize data to inform decision-making. In simpler terms, BI is about transforming vast amounts of raw data from across a company into meaningful, actionable information.
At its core, a BI system usually includes a few key components or layers:
- Data sources and storage: Data from various sources (databases, CRM/ERP systems, spreadsheets, etc.) is consolidated into central storage like a data warehouse or data lake. This ensures a “single source of truth” for all business data.
- Data integration and preparation: Processes such as ETL (Extract, Transform, Load) clean and combine data so it’s consistent and analysis-ready. Data quality management and governance are crucial at this stage to ensure accuracy.
- Analytics and processing: Here is where data mining, statistical analysis, and algorithms come into play. BI encompasses descriptive analytics (examining historical and current data to understand what is happening), as well as more advanced techniques like predictive analytics (forecasting future outcomes) and even prescriptive analytics (suggesting actions).
- Visualization and reporting: The final layer is the user interface – often interactive dashboards, reports, and scorecards – that presents insights in an easily digestible format (charts, graphs, KPIs) for business users. This is what end-users (from executives to frontline employees) interact with to monitor performance and derive insights.
Together, these components form a complete business intelligence solution that empowers organizations to monitor KPIs, spot trends, and act with confidence. The applications of BI are vast now, from tracking revenue and customer behavior to identifying process bottlenecks and spotting market trends.
So, why does this all matter now more than ever? Let’s explore how BI delivers value across different business sizes and roles.
Why Business Intelligence Matters
Data has become the fuel for modern business, but without the right tools to harness it, opportunities go unnoticed. No matter the size or scope of your organization, business intelligence has become critical to every business that aims to stay sharp and evolve. Therefore, we have categorized the implementation as per the following operational scales of business:
Small Business Owners:
Modern business intelligence solutions are no longer reserved for big budgets. Cloud-based, self-service platforms allow small companies to monitor KPIs, reduce inefficiencies, and respond quickly to market shifts. These tools are accessible, affordable, and intuitive—no IT team required.
Enterprise Executives:
For larger organizations, BI is essential for strategy and scale. Executives rely on business intelligence technologies to consolidate global data, track operational performance, and forecast trends. By automating reports and creating a single source of truth, BI reduces risk and increases ROI across the enterprise.
Analysts and Data Teams:
BI enhances efficiency by streamlining workflows, automating reporting, and supporting complex analysis. With tools that offer AI-powered forecasting and natural language queries, analysts can focus on uncovering actionable insights rather than cleaning spreadsheets.
Whether you’re optimizing a growing startup or leading a multinational, the value of BI lies in its ability to unlock clarity at every level. Let’s now explore how these insights come to life through real-world BI applications.
Common Business Intelligence Applications (Use Cases)
Business intelligence can be applied wherever data lives in your business. Here are some of the most common BI applications that consistently deliver measurable value across industries and company sizes:
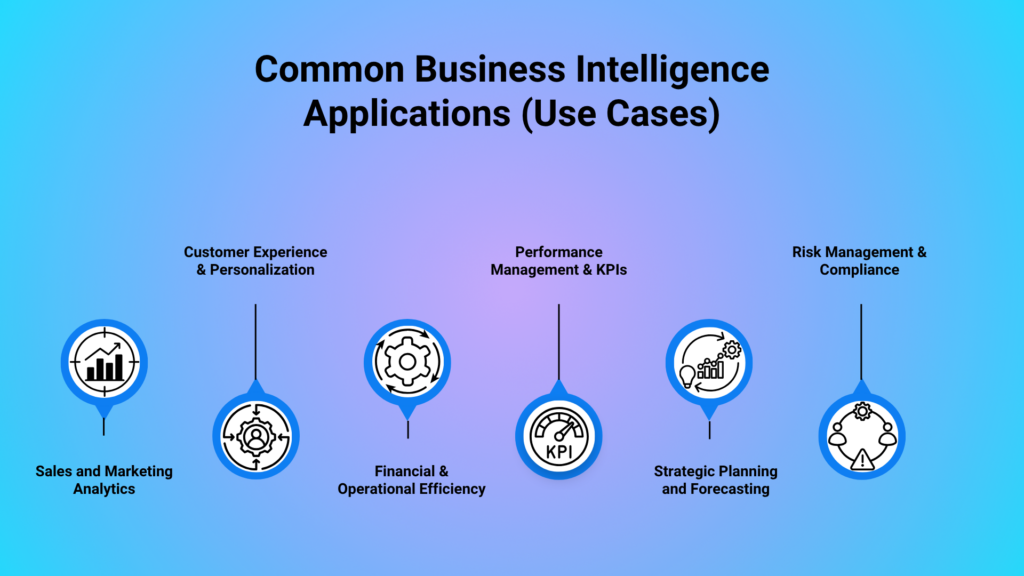
Sales and Marketing Analytics
Business intelligence applications in sales and marketing allow businesses to analyze real-time sales performance, track lead conversions, and optimize marketing ROI. Dashboards highlight customer segments, product trends, and channel performance—helping teams make data-driven decisions about pricing, promotions, and outreach. This leads to higher revenue through smarter targeting and better personalization.
Customer Experience & Personalization
BI tools aggregate customer feedback, transaction history, and digital behavior to identify pain points and personalize experiences. Whether you’re a small e-commerce brand or a large retailer, intelligent business applications help you deliver timely support, anticipate needs, and build loyalty by offering services or promotions based on real user behavior.
Financial Management & Operational Efficiency
Applications of business intelligence are essential in finance and operations. BI enables teams to monitor expenses, track profitability, manage vendor performance, and optimize supply chains. By visualizing patterns like rising costs or delayed shipments, companies, from small retailers to global manufacturers, can take proactive measures to enhance efficiency and reduce operational waste.
Performance Management & KPIs
Organizations use BI dashboards to track performance metrics across teams and functions. Managers can monitor KPIs like project completion rates, employee productivity, or customer satisfaction. This business intelligence use case example promotes transparency, identifies bottlenecks, and empowers teams to adjust goals or processes in real time to improve outcomes.
Strategic Planning and Forecasting
BI isn’t just about hindsight—it supports foresight. By analyzing historical data, companies can forecast sales, anticipate seasonal demand, and plan resource allocation. These BI applications help leadership teams make informed strategic decisions, reduce risk, and prepare for market shifts, turning data into a proactive planning advantage.
Risk Management & Compliance
Businesses rely on BI to detect anomalies, track compliance metrics, and manage financial risks. For instance, BI can flag unusual transactions, monitor regulatory thresholds, or analyze audit trails. This business intelligence application protects companies, whether small or enterprise, from fraud, legal penalties, and operational blind spots.
These diverse business intelligence use cases are applicable across sectors—be it retail, healthcare, logistics, or finance. BI’s flexibility ensures that whether you’re improving marketing or ensuring compliance, the right application exists to fit your goals.
Let’s now explore the tools that power these outcomes: leading BI solutions and platforms.
Top 10 Business Intelligence Tools: In-Depth Comparison of Modern BI Platforms
Modern businesses have no shortage of options when it comes to business intelligence solutions. In this overview, we examine ten leading BI tools – from established enterprise platforms to newer self-service BI software. Each profile covers the tool’s core purpose, standout features, limitations, and the types of businesses it’s best for, to help you confidently evaluate which business intelligence software fits your needs.
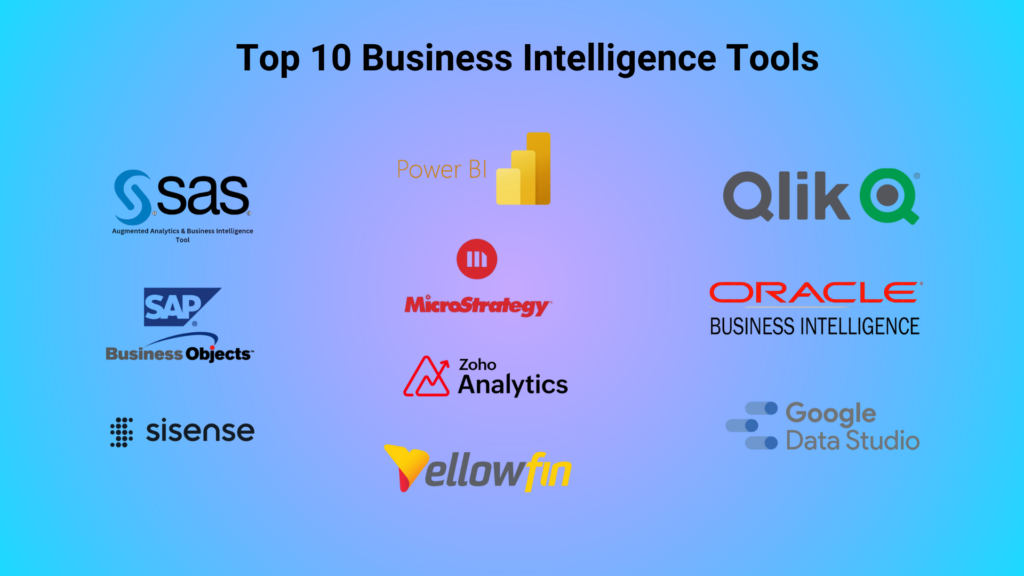
SAP Business Objects
SAP BusinessObjects is an enterprise-focused business intelligence suite known for robust reporting and analysis. It offers a collection of mature tools for ad-hoc queries, formatted reports, and dashboards, making it valuable for organizations needing governed, repeatable reporting at scale. Its long-standing integration with SAP data sources and emphasis on report distribution provide a reliable, if traditional, BI solution for large enterprises.
Key Features:
- Comprehensive BI suite with modules for pixel-perfect reporting, ad-hoc analysis, and dashboards (e.g., Crystal Reports, Web Intelligence).
- Strong report scheduling & distribution capabilities for enterprise-wide information delivery.
- Business-user-oriented tools (Web Intelligence, Analysis for Office) support self-service BI for non-technical users.
- Mobile BI access via dedicated app/HTML5, allowing consumption of reports on the go.
- Integrates with a wide range of data sources (SAP and non-SAP), leveraging SAP’s ecosystem for unified reporting across enterprise systems.
Limitations:
- Collection of separate tools with integration mostly at the data level, resulting in a less unified user experience across components.
- Slow innovation and long release cycles, as the platform has seen few major updates, trailing newer modern BI tools in features.
Best For: Enterprises (especially those already using SAP software) that require a proven, governed BI solution for standardized reporting and broad report distribution. It’s ideal for organizations that prioritize stability and comprehensive report publishing over cutting-edge visualization.
Microsoft Power BI
Microsoft Power BI is a modern business intelligence platform that excels in interactive data visualization and self-service analytics. Integrated within the Microsoft ecosystem, it connects effortlessly to hundreds of data sources, enabling users to build shareable dashboards and reports with an intuitive drag-and-drop interface. Its expanding AI-driven features and affordability have made Power BI a top choice for organizations ranging from small businesses to large enterprises seeking robust business intelligence solutions.
Key Features
- User-friendly drag-and-drop interface allows non-technical users to create interactive reports with ease.
- AI-powered insights, including natural language queries (“Q&A”) and the Copilot assistant, help uncover trends automatically.
- Wide data connectivity supports seamless integration with databases, cloud services, Excel, Azure, and Microsoft 365 tools.
- Advanced data modeling and ETL through Power Query and DAX enable complex analytics within a straightforward environment.
Limitations
- Complex paginated reporting requires IT support and separate tools, limiting business user autonomy.
- The combination of desktop and cloud services can be confusing due to multiple environments and publishing steps.
Best For: Power BI suits businesses of all sizes, especially those embedded in the Microsoft ecosystem. It’s ideal for organizations needing a cost-effective, scalable business intelligence solution with rapid deployment and expanding AI capabilities.
SAS Augmented Analytics & Business Intelligence
SAS combines traditional business intelligence solutions with advanced analytics and AI in a powerful, unified platform. It supports data preparation, visualization, and predictive modeling, leveraging SAS’s renowned analytics engine. By embedding machine learning-driven insights and automation, SAS accelerates data discovery, allowing both business users and analysts to gain deeper insights more quickly and with less manual effort, making it a preferred choice for data-intensive environments.
Key Features
- Integrated advanced analytics offers embedded machine learning, statistical modeling, and forecasting, enabling predictive and prescriptive analysis within the BI environment.
- Optimized for large-scale data, SAS efficiently processes massive datasets and complex computations with high performance.
- Augmented analytics capabilities provide automated insights, including key driver explanations, anomaly detection, and natural language generation.
- Flexible user experience features include drag-and-drop dashboards for business users, plus coding options (SAS, Python, R) for data scientists, bridging ease of use and customization.
Limitations
- High total cost of ownership with premium pricing and significant investment requirements that can put SAS out of reach for smaller businesses.
- Steep learning curve means advanced use demands specialized skills and training, which can limit accessibility and slow adoption.
Best For: SAS is best suited for large enterprises and data-driven organizations in sectors like finance, healthcare, and government, requiring advanced analytics tightly integrated with business intelligence solutions.
Qlik Sense
Qlik Sense is a modern business intelligence software renowned for its associative analytics engine, which allows users to explore data freely without restrictions. It enables the creation of interactive dashboards that dynamically associate data from multiple sources, helping uncover hidden insights often missed by traditional query-based tools. Balancing self-service flexibility with centralized governance, Qlik Sense empowers organizations to enhance data discovery and exploration.
Key Features
- Associative data engine lets users explore relationships between data points in real time, revealing insights beyond predefined queries.
- Fast in-memory processing supports responsive dashboards and real-time analysis on large datasets.
- Extensive data connectivity and ETL enable integration from diverse sources, with powerful scripting for transformations.
- Augmented analytics with Insight Advisor uses AI to suggest visualizations and answer natural language queries.
Limitations
- Moderate learning curve, especially mastering data loading scripts and complex modeling.
- Higher costs and scaling expenses may be challenging for small businesses.
Best For: Qlik Sense suits mid-sized to large organizations looking for a flexible, powerful business intelligence solution that supports deep, fast analytics across complex data environments. It’s ideal for teams ready to invest in training and customization for richer insights.
MicroStrategy
MicroStrategy is an enterprise-grade business intelligence solution known for its scalability, governance, and extensive capabilities. It offers a comprehensive environment to create everything from pixel-perfect operational reports to interactive dashboards and mobile BI apps. Recently, MicroStrategy has integrated AI features like “HyperIntelligence” cards and an NLP assistant, enhancing its strong BI foundation. Organizations choose MicroStrategy for delivering a single version of the truth via a unified semantic layer and serving large user bases securely and reliably.
Key Features
- Unified semantic layer ensures consistent definitions for KPIs across all dashboards and reports, enabling governed enterprise BI.
- Proven scalability and performance handle large datasets with fast in-memory caching and query optimization for efficient, concurrent dashboard use.
- Versatile analytics supports both self-service data discovery and pixel-perfect reporting within the same platform, plus embedded analytics integration.
- AI and ML integration includes an AI assistant and natural language query features to surface insights and generate visualizations automatically.
Limitations
- Outdated user interface may feel less intuitive and visually appealing compared to newer BI tools.
- High cost and resource intensity require significant investments in licensing, infrastructure, and skilled personnel.
Best For: Large enterprises need a highly scalable, secure BI platform with strong governance, especially in finance, telecom, and retail sectors, requiring a unified, consistent data view for thousands of users.
Zoho Analytics
Zoho Analytics is a self-service business intelligence solution within the Zoho software suite, designed for ease of use by non-technical users. It enables fast data analysis, visualization, and insight discovery. Its affordability and quick deployment make it a popular choice among small and mid-sized businesses. Despite its simplicity, Zoho Analytics incorporates AI-powered features such as the Zia assistant, delivering automated insights to enhance decision-making.
Key Features
- User-friendly interface offers drag-and-drop report building and pre-built visualizations, enabling quick dashboard creation without coding.
- Broad data connectivity supports integration with over 500 data sources, allowing seamless blending of data from Zoho apps and external platforms.
- AI-powered assistant (Zia) enables natural language queries, anomaly detection, and forecasting to generate instant reports and insights.
- Collaboration tools allow secure sharing, commenting, and embedding of live reports to foster a collaborative data culture.
Limitations
- Limited advanced analytics capabilities may not meet power users’ needs for complex machine learning or custom visualizations.
- Performance issues can arise with very large datasets, making it better suited for small to mid-sized data volumes.
Best For: Small to mid-sized businesses or departments seeking a cost-effective, easy-to-use BI platform. Especially beneficial for teams already using Zoho products or those needing rapid, low-IT reporting and dashboarding capabilities.
Sisense
Sisense is a comprehensive business intelligence platform known for its scalability, powerful data handling, and embedded analytics capabilities. It offers end-to-end BI solutions from data preparation to visualization, with an emphasis on customization and high performance. Sisense’s unique in-chip technology accelerates processing of large datasets, enabling fast, responsive analytics for both business users and developers. Its AI-driven features enhance insights through natural language queries and predictive analytics, supporting proactive decision-making.
Key Features
- Embedded analytics leader enabling seamless integration of interactive dashboards and reports into web applications with extensive APIs and white-label options.
- Scalable high-performance engine uses in-memory and optimized disk storage to handle growing data volumes efficiently without slowing down.
- AI-driven insights incorporate machine learning and natural language querying for predictive analytics and anomaly detection.
- Highly customizable and extensible with no-code dashboards for business users and advanced scripting for developers to meet unique requirements.
Limitations
- Advanced feature learning curve requires technical expertise to fully leverage custom coding and complex ETL processes.
- Smaller community and ecosystem means fewer third-party resources and challenges in finding experienced developers.
Best For: Mid-to-large enterprises, especially product-oriented companies, need embedded analytics within client-facing apps. Ideal for organizations with complex data environments and strong developer support wanting tailored BI experiences beyond standard tools.
Google Data Studio (Looker Studio)
Google Data Studio, now part of Google’s Looker family, is a free, cloud-based business intelligence solution designed for creating interactive dashboards and reports. It excels at visualizing data from Google products like Analytics, Ads, and BigQuery, making it a favorite for marketers and small businesses. Its user-friendly drag-and-drop interface and seamless collaboration features allow teams to build and share insights quickly without heavy IT involvement. While simpler than enterprise-grade BI platforms, its accessibility and cost-effectiveness position it well for those starting their data-driven journey.
Key Features
- Free to use with unlimited reports and viewers, removing cost barriers for BI adoption.
- Native Google integrations enable easy connection to Google Analytics, Ads, Sheets, and more, ensuring smooth data flow.
- Simple report creation using drag-and-drop tools and pre-built chart libraries for quick dashboard development.
- Collaboration and sharing allow real-time editing and report distribution, similar to Google Docs.
Limitations
- Limited data transformation capabilities require external preparation for complex joins or data shaping.
- Connector dependency means third-party data sources may incur additional costs or limitations.
Best For: Small businesses, marketing teams, and startups need a budget-friendly, easy-to-use tool primarily within the Google ecosystem. Ideal for quick reporting and client dashboards without complex BI requirements.
Yellowfin BI
Yellowfin BI is a fully web-based business intelligence platform known for its distinctive focus on data storytelling and collaboration. It offers comprehensive analytics capabilities, from data discovery to reporting and dashboards, enhanced by unique features like Yellowfin Stories for narrative reports and Signals for AI-driven alerts. Yellowfin helps users not only uncover insights but also communicate them effectively to drive informed decision-making.
Key Features
- Enables creation of rich narrative reports combining visuals, text, and multimedia, helping contextualize insights for stakeholders.
- AI-powered monitoring detects anomalies and trends, notifying users proactively of timely action.
- Built-in tools allow commenting, annotating, and sharing insights in real-time, fostering a data-driven culture.
- Highly customizable for integration into applications, enabling software vendors to embed analytics seamlessly.
Limitations
- Limited community and fewer third-party integrations compared to BI giants may impact support and resources.
- The broad feature set can overwhelm new users, requiring training to maximize platform benefits.
Best For: Mid-sized enterprises or departments seeking a collaborative, easy-to-use BI platform focused on engaging data presentation. Ideal for organizations valuing storytelling and embedded analytics with moderate BI complexity.
Oracle BI
Oracle BI, now part of Oracle Analytics, is a powerful enterprise business intelligence platform known for its robust reporting, analysis, and dashboard capabilities. It integrates deeply with Oracle databases and applications, making it ideal for organizations reliant on Oracle’s technology stack. Oracle BI’s semantic layer ensures consistent definitions and efficient querying, while its scalability supports thousands of users and large data volumes. Its comprehensive functionality covers operational reporting, interactive dashboards, and pixel-perfect formatted reports, making it suitable for complex and governed BI environments.
Key Features
- Tight Oracle integration ensures optimized performance by querying Oracle databases directly, minimizing data movement.
- Enterprise scalability and security support thousands of users with row-level security and clustering for heavy workloads.
- Comprehensive BI tools include interactive dashboards, ad-hoc queries, OLAP analysis, and pixel-perfect formatted reports.
- Semantic data model (RPD) provides a single source of truth by defining metrics and hierarchies centrally for consistent reporting.
Limitations
- Complex deployment demands significant IT expertise due to architecture complexity and a steep learning curve for data modeling.
- Outdated user experience with less intuitive dashboards and a developer-centric UI compared to modern BI platforms.
Best For: Large enterprises heavily invested in Oracle technologies, needing a secure, scalable, and centralized BI platform with strong governance, especially in finance, manufacturing, and the public sectors.
Choosing the right business intelligence tool is key to unlocking data-driven insights. As we’ve seen, each platform offers unique features suited for different business needs. Whether you’re looking for ease of use, scalability, or advanced analytics, these BI solutions provide the tools to transform your data into actionable intelligence.
Further, you may go through the real-world examples of business intelligence that will give you more clarity regarding the impact of these solutions in your business.
Top 10 Real-World Business Intelligence Examples (Case Studies)
Business intelligence (BI) comes to life in real-world case studies where data-driven insights solve critical business challenges. The following examples span industries from retail and finance to healthcare, manufacturing, and logistics, highlighting how organizations both large and small leverage modern BI platforms for competitive advantage. By examining these success stories, we can see how business intelligence solutions and BI applications drive operational efficiency, enhance customer experiences, and fuel data-driven decision-making across the board.
Amazon, an E-commerce Company, Optimized Supply Chain Efficiency
Business overview: Amazon is a global e-commerce and cloud computing leader known for its customer-centric operations.
Challenge: Managing millions of products and a vast global supply chain, Amazon faced logistical complexity in inventory forecasting and fast fulfillment at scale. Inefficient supply chain visibility risks overstocking or stockouts, increasing costs, and customer dissatisfaction.
Solution: The company implemented a modern BI platform with machine learning for demand forecasting and real-time analytics for logistics. These business intelligence tools analyze huge datasets (sales trends, browsing behavior, warehouse operations) to anticipate regional product demand, optimize inventory levels, and dynamically route deliveries.
Results: Amazon’s data-driven strategy significantly improved operational efficiency – it reduced warehousing costs by 25% and cut delivery times by 40% through optimized routing. Personalized BI-powered recommendations now generate 35% of annual sales, markedly boosting revenue and customer satisfaction.
Netflix, a Streaming Company, Boosted Viewer Engagement and Retention
Business overview: Netflix is a leading entertainment streaming service with hundreds of millions of subscribers worldwide.
Challenge: The company needed to retain subscribers and increase engagement in a highly competitive streaming market. It struggled to ensure viewers quickly find content they enjoy before losing interest.
Solution: Netflix invested in advanced BI applications and analytics, notably a sophisticated recommendation engine powered by big data and AI. By mining viewing history and user preferences, the system suggests content personalized to each subscriber. Real-time dashboards and A/B testing further inform content development and user interface improvements.
Results: Netflix’s data-driven personalization has been pivotal – about 80% of content watched on Netflix is driven by its recommendation engine. More importantly, the company estimates these BI insights save over $1 billion per year by reducing subscriber churn through improved retention, illustrating the massive impact of business intelligence solutions on its bottom line.
Walmart, a Retail Company, Reduced Stockouts and Boosted Revenue
Business overview: Walmart is the world’s largest retailer, operating thousands of stores and a huge e-commerce platform.
Challenge: With a vast product catalog and global supply chain, Walmart faced frequent stockouts, overstock issues, and difficulty understanding local customer preferences. These problems led to lost sales and high holding costs.
Solution: Walmart deployed a comprehensive BI and data analytics strategy (partnering with a big data platform) to centralize and analyze sales transactions, inventory levels, weather patterns, and regional trends. This allows managers to proactively rebalance stock, optimize the supply chain, and tailor assortments to local needs using business intelligence tools instead of spreadsheets.
Results: The BI initiatives led to tangible improvements. Walmart reduced product stockouts by 16%, improving product availability and sales. It also streamlined its logistics, cutting supply chain costs by around 10%, which helped increase overall revenue by about 2.5% (Source: Tran-sights). Additionally, more data-driven merchandising boosted customer retention and loyalty, contributing to sustained growth.
American Express, a Financial Services Company, Enhanced Customer Retention and Fraud Detection
Business overview: American Express (Amex) is a major global financial services corporation, offering credit cards, payments, and travel services.
Challenge: Amex needed to reduce customer attrition and fraud in its credit card business. Identifying customers at risk of closing accounts or detecting fraudulent transactions early were key challenges given millions of accounts and transactions.
Solution: Amex invested in BI solutions and predictive analytics to mine transaction data and customer behaviors. Using machine learning models, Amex can flag unusual spending patterns that indicate fraud in real time and analyze account usage trends to predict which customers are likely to churn. These insights are delivered through dashboards to marketing and risk teams.
Results: Business intelligence significantly improved Amex’s foresight. In one market experiment, the company’s models could identify up to 24% of customers likely to close their accounts within 4 months, enabling proactive retention outreach. Likewise, Amex’s AI-driven fraud detection systems (powered by BI data integration) have reduced fraudulent losses and improved customer trust.
Tesla, an Automotive Manufacturing Company, Increased Operational Efficiency
Business overview: Tesla is an innovative electric vehicle manufacturer that also provides energy storage and solar products.
Challenge: Tesla wanted to maintain superior customer experience and vehicle reliability as its user base grew. The company faced the challenge of detecting vehicle issues proactively to minimize costly recalls or breakdowns and to use real-world driving data to inform design improvements.
Solution: Tesla turned its cars into rolling data generators – every Tesla vehicle sends telemetry and performance data back to the company’s BI systems. Using business intelligence tools and AI, Tesla analyzes this stream of data (covering battery health, component performance, driving patterns, etc.) to perform predictive maintenance and issue over-the-air software updates. Internal dashboards flag anomalies in fleet data so engineers and service teams can address problems before they impact customers.
Results: As a result, the company enjoys industry-leading customer satisfaction – its Net Promoter Score is an astounding 97, indicating an extremely loyal customer base. In surveys, 99% of Tesla Model 3 owners said they would recommend the car to others (Source: customergauge).
Apollo Hospitals, a Healthcare Company, Reduced ER Wait Times
Business overview: Apollo Hospitals is a large hospital network known for adopting modern healthcare technologies across its multi-specialty facilities.
Challenge: One Apollo hospital (a 350-bed facility) was struggling with overcrowded emergency rooms and long patient wait times averaging over 90 minutes. This led to lower patient satisfaction and burned-out staff. The hospital needed to optimize its emergency department operations by predicting patient influx and better allocating resources.
Solution: The hospital deployed a BI solution combining historical data analysis and real-time dashboards. Two years of ER data were analyzed to identify peak times and bottlenecks. A live BI dashboard (built with tools like Power BI) now tracks patient flow from triage to discharge in real time, giving staff visibility into bed availability and queue lengths. Predictive models (using machine learning) forecast daily ER arrivals, allowing management to adjust doctor/nurse schedules proactively.
Results: Within three months of implementing these BI initiatives, ER wait times dropped by 40% on average, and Patient satisfaction scores rose by 18%. Staff efficiency improved by 22% as the right number of clinicians were scheduled at the right times, easing burnout (Source: LinkedIn).
Univision, a Media Company, Increased Advertising Yield
Business overview: Univision is a leading Spanish-language media network in the United States, with television, radio, and digital properties.
Challenge: Univision needed better insight into its advertising operations. The company wanted to optimize its ad inventory pricing and targeting, especially for programmatic TV and digital ads, but its data was siloed and not easily actionable.
Solution: Univision adopted a unified BI strategy to aggregate data from ad delivery platforms (including social media analytics and web analytics) into a single view. By analyzing performance metrics across TV and digital channels, the company used BI tools to identify opportunities for improved targeting and dynamic pricing of ad slots. Programmatic advertising platforms powered by BI allowed for automated, data-driven ad placements and audience targeting in real time.
Results: Shortly after implementing these BI-driven changes, the network achieved an 80% growth in ad yield in the first quarter after rolling out the new BI system. The ability to target audiences more precisely also improved advertiser satisfaction and ROI. Univision’s case shows how media companies can use BI applications to maximize revenue in the era of data-driven ad buying.
Twitter: Now ‘X’, a Social Media Company, Improved Content Moderation with BI and AI
Business overview: Twitter is a global social media platform where millions of users post short messages (“tweets”) in real time.
Challenge: Twitter needed to police harmful content (such as extremist or violent material) swiftly to maintain user safety and comply with regulations. The challenge was to leverage data and automation to detect and act on problematic content while improving the overall user experience.
Solution: Twitter implemented a combination of BI analytics and artificial intelligence to monitor content. Machine learning models (trained on tweet data) scan and flag potentially problematic tweets or accounts. These BI tools analyze patterns in user behavior and language in real time. Twitter’s internal dashboards provide moderators with trends and alerts.
Results: The integration of BI and AI has dramatically improved Twitter’s content moderation efficiency. Approximately 95% of accounts suspended for promoting terrorism are now identified by algorithms before any human flags them. Moreover, Twitter’s data-driven approach to content ranking and recommendations has improved user engagement by ensuring users see more relevant tweets and videos.
Caterpillar, a Heavy Equipment Company, Reduced Downtime with Predictive Analytics
Business overview: Caterpillar is a leading manufacturer of heavy machinery and industrial equipment, such as construction vehicles and generators, sold worldwide.
Challenge: Unplanned equipment breakdowns at customer sites lead to costly downtime and emergency repairs. The challenge lay in analyzing sensor data from thousands of machines to pinpoint early warning signs of trouble and schedule maintenance optimally.
Solution: Caterpillar deployed IoT sensors on its machinery and built a predictive maintenance program using BI and AI. Data from machines in the field streams into Caterpillar’s centralized Machine Health Monitoring Center, where business intelligence platforms analyze it in real time. Machine learning models were developed to predict failures, for example, detecting patterns like a combination of rising hydraulic pressure and high temperature that typically precedes a component fault.
Results: Equipment downtime has been reduced by about 30%, leading to fewer project delays for customers and higher satisfaction. Caterpillar and its dealers also benefit financially: preventing failures lowers warranty costs and emergency repair expenses.
UPS, a Logistics Company, Saved 10 Million Gallons of Fuel Per Year
Business overview: UPS is a global package delivery and logistics company, operating a fleet of tens of thousands of vehicles worldwide.
Challenge: UPS drivers make hundreds of stops daily, and planning the optimal route (sequence of stops) is an extremely complex problem. UPS’s challenge was to leverage data to dynamically optimize each driver’s route to minimize miles driven, idle time, and fuel consumption, without delaying deliveries.
Solution: UPS developed a BI-driven route optimization system called ORION (On-Road Integrated Optimization and Navigation). ORION uses advanced analytics and heuristic algorithms to evaluate over 200,000 possible route combinations for a driver’s daily stops and select the most efficient path. It ingests data like package locations, traffic conditions, and delivery time commitments. The system runs on a modern BI platform that continuously recalculates routes throughout the day as conditions change.
Results: Since ORION’s rollout, UPS has been saving roughly 100 million miles of driving per year, which equates to about 10 million gallons of fuel saved annually (Source: 3newsnow). This not only slashes fuel costs (on the order of $300–$400 million savings per year) but also cuts carbon emissions by about 100,000 tons (Source: informs.org). Drivers now drive fewer miles while maintaining on-time delivery performance, thanks to data-optimized routes.
The power of BI is best understood through real-world examples. These case studies showcase how businesses across industries have leveraged BI to drive operational efficiencies, enhance customer engagement, and boost revenue.
Plus, if you are curious to apply any of the business intelligence applications that fits your business scenario, you must read the practical steps ahead.
Best Practices for BI Implementation and Data-Driven Success
Launching a successful business intelligence solution requires more than installing software—it demands the right goals, people, tools, and processes.
From executive alignment to iterative delivery, the following best practices help organizations of all sizes unlock value and achieve sustained data-driven success with their BI services.
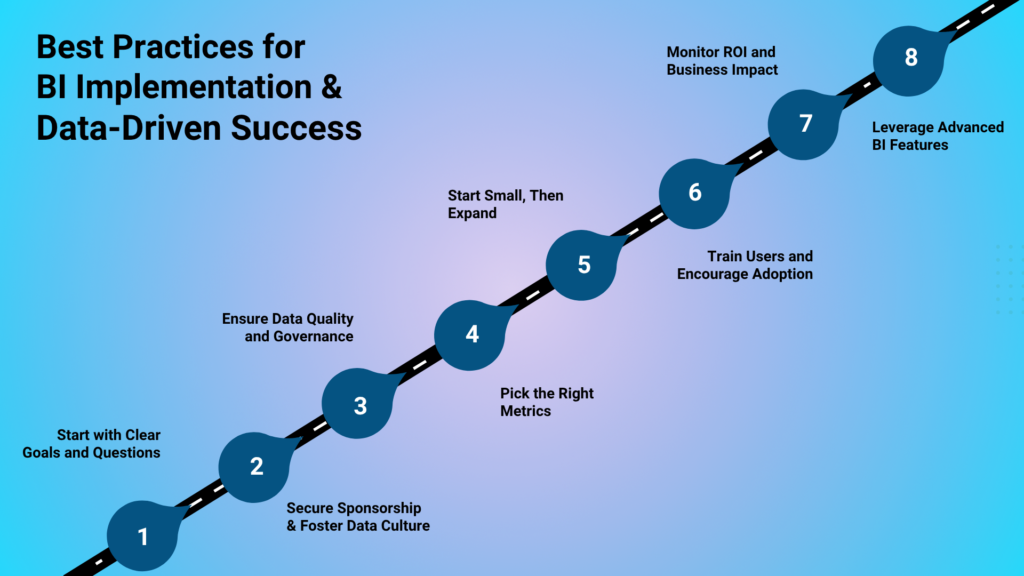
1. Start with Clear Goals and Questions
Every successful BI journey starts with defining specific objectives and KPIs. Focus on solving clear business problems, like reducing churn or improving operational efficiency. These goals shape what data to collect and how to use it. Understanding the “why” behind your business intelligence solution is key to staying aligned with business impact.
2. Secure Executive Sponsorship and Foster a Data Culture
Leadership support ensures visibility and funding for your enterprise business intelligence solution. Appoint sponsors who champion the initiative and help remove roadblocks. Promote a data-driven culture by openly sharing dashboards and tying decisions to insights. When executives value data, employees follow, making business intelligence services part of the organizational mindset.
3. Ensure Data Quality and Governance
“Garbage in, garbage out” holds true for BI. Invest in consistent data definitions, cleaning practices, and governance processes. This ensures your business intelligence automation outputs are accurate and trusted. Define roles, manage permissions, and use tools with data lineage features to create transparency. Reliable data is the foundation for confident decision-making.
4. Pick the Right Metrics (and Avoid Vanity Metrics)
Focus on KPIs that align with strategic goals. Avoid cluttering dashboards with vanity metrics that don’t drive action. Instead, use meaningful indicators—like customer lifetime value or conversion rates—that reflect real performance. A clean, goal-oriented dashboard boosts trust in your business intelligence solution and helps users take focused, informed action.
5. Start Small, Then Expand
Rolling out BI enterprise-wide from day one is risky. Begin with a high-impact pilot, like sales reporting, using business intelligence automation. Deliver quick wins, gather feedback, and scale gradually. This agile approach builds internal advocacy and adapts to change. Think big, but implement iteratively to match business evolution.
6. Train Users and Encourage Adoption
Tools are only as good as their users. Provide tailored training—simple walkthroughs for business users, deep dives for analysts. Appoint BI champions within teams and embed dashboards into daily routines. Increased adoption of your BI services leads to greater data literacy, higher ROI, and more decisions driven by real-time insights.
7. Monitor ROI and Business Impact
Track how your business intelligence services impact time, cost, and revenue. Metrics like reduced reporting hours or improved forecasting accuracy prove value and inform future improvements. Use platform engagement analytics to identify underused dashboards or standout features. Treat BI as an evolving program, not a one-time deployment.
8. Leverage Advanced BI Features (When Ready)
Once basics are in place, tap into advanced capabilities like augmented analytics, real-time dashboards, or natural language queries. These elevate your business intelligence automation efforts, helping you discover hidden patterns and predict trends. Especially for fast-paced industries, advanced BI can offer a competitive edge through smarter, faster insights.
By following these best practices, you can avoid common pitfalls and maximize the value of your BI investments. Whether you’re just starting out with BI or expanding an existing analytics program, a thoughtful approach like this sets you up for success.
Conclusion: Embrace BI for Data-Driven Success
Business intelligence solutions enable data-driven success by turning raw data into actionable insights, enhancing decisions, and streamlining operations. From small businesses to global enterprises, organizations that harness data effectively thrive. BI tools provide the means to gain insights, but success depends on a clear strategy and purpose.
Whether you’re a business owner, executive, or analyst, investing in BI opens new performance levels. Start by identifying key questions data can answer, implement a fitting solution, and foster a data-driven culture. Even small BI initiatives can drive significant gains, from revenue boosts to efficiency improvements.
With modern BI tools offering quick trials, it’s easier than ever to begin. Embrace BI now to unlock your data’s full potential and stay competitive in today’s data-driven world.